Indoor Sport Services Training Guide
Our Indoor Rowing Training Guide is the ultimate training resource for the Indoor Rower. Written by top education and coaching specialists, it includes information on technique and training, with programmes on cross-training, 2,000m and marathon race training, weight management and keep fit. There are guest chapters written by top names such as Jurgen Grobler and Chris Shambrook as well as dedicated sections on psychology, nutrition and weight training.
Creating a Bespoke Training Programme - Personalising Your Programme - the Danish Programme
<< Structuring The YearProgramme Guidelines >>by Kurt Jensen
Denmark does not have many rowers and so it is vital that we provide a tailored training programme to meet their individual needs. This extends beyond physical training to encompass psychological and nutritional support.
One of the methods used to define individual training intensities is to produce a power/endurance curve on the Indoor Rower for each athlete. Five key points are established as a result of this test, which is carried out over one week:
- Maximum power output over ten seconds.
- Anaerobic capacity over 60 seconds, stroke rate 36 to 46.
- Race pace over 2,000m, stroke rate 30 to 34.
- Aerobic capacity over 6,000m, stroke rate 26 to 28.
- Endurance over 60 minutes, stroke rate 22 to 24.
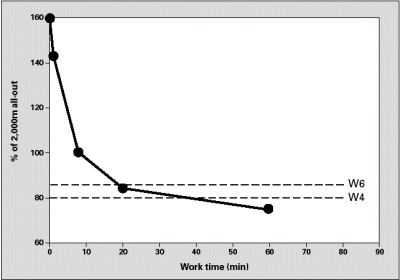
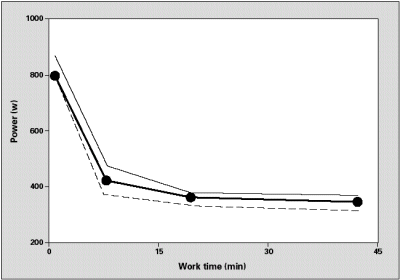
A graph of power/time is then plotted and the individual's power output at blood lactate levels of four and six mmol/l are superimposed. We call these points W4 and W6 respectively. They would have been collected from a standard sub maximal step test. The work time at these two key points can then be read off directly from the graph. Below are two graphs, the first showing the results of an individual with the power represented as the percentage of power produced in the 2,000m test. The second is a graph of power against work time.


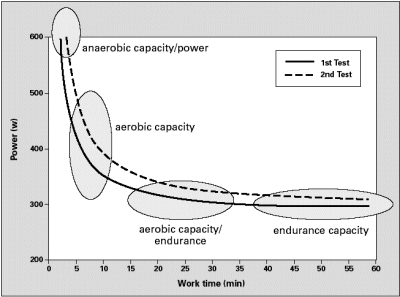
The average power is the thick line and the maximum and minimum values are also indicated. The graph below shows the four areas of anaerobic capacity/power, aerobic capacity and aerobic capacity/endurance and endurance capacity.

Training intensities were defined as follows:
Table 4.6
| Training Intensities | |||||
|---|---|---|---|---|---|
| Training Intensity | Level | % of Max | Stroke Rate | Time in Range | Heart Rate |
| Anaerobic Capacity/Power | A | 110%+ | 36-46 | 3-5 mins. Short intervals | 100% |
| Aerobic Capacity | B | 9-100% | 30-34 | 20-25 mins. Med intervals. | 95-100% |
| Aerobic Capacity/Endurance | C | 70-78% | 26-28 | 40-45 mins. Long intervals. | 80-90% |
| Endurance | D | 60-70% | 22-24 | 60 mins. | 65-75% |
| Recovery/Technical Improvement | E | <60% | - | - | <65% |
Notes
Max refers to output for 2,000m piece.
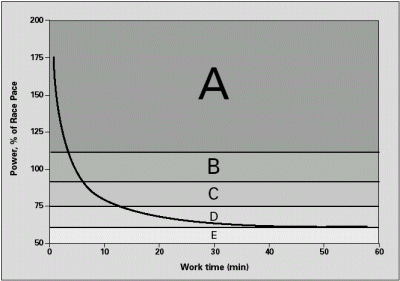
The levels can be represented by a power graph. This shows the power output for each level. The training time in this level can then be read from the table above.

Traditionally, Danish rowers have not been able to train on the water in winter and so training is land based. Six to eight hours a week are spent on the Indoor Rower out of a total of eight to 12 hours. Training based around the rowing machine is far more efficient than training on the water. Some of the athletes measured are fitter in the winter than summer when the training becomes more water based. When the rowers move from the land to water the training time increases to 16 hours a week. This is less than the time spent training by British lightweights who tend to row right through the winter. An explanation for this is, because the Danes are fitter when they move onto the water, they are able to train at a higher intensity. However, not all the Danish rowers are able to transfer their fitness gains into boat speed and so specific onboard tests are being carried out to see exactly where this power is being lost.
In recent years climate change has meant it would be possible for the Danes to train on the water in winter but they don't see any advantage because far more time would be required to achieve the same fitness levels. When they do move onto the water, the volume of training increases and this increase plus the rise in ambient temperature, is all that is needed to bring down the weight of the rowers from a winter high of +6 kilos.
Lightweights should not reduce their food intake as this leads to negative energy levels where the athlete is unable to train at a high intensity. Positive energy levels are achieved by having enough fuel to cope with the demands of the training regime. When you enter negative energy your percentage body fat will actually increase as a result of reduced food intake. In some cases, additional nutritional advice is needed to help rowers meet their target weight. Young rowers, those under 21 years, should be actively discouraged from dieting to make the lightweight limit.
There is no reason why heavyweights and lightweights should not follow the same training regime. The only exception is in the area of weight training to develop strength. Here the heavyweight has the advantage of being able to increase muscle mass whereas the lightweight is limited by total body weight constraints. Beyond a certain strength level however, there is no evidence that more strength results in improved performance over 2,000m. A number of athletes were tested for strength by fixing the chain on the Concept 2 Indoor Rower and introducing a strain gauge to the handle. The strength difference in the athletes tested ranged from 160kg to 280kg, a difference of 80%. However, when they were then asked to row 2,000m, the rower with the lowest score was able to maintain a power output of 400 watts and was near to the top of the group.
Although a heavyweight rower has a higher VO2 max in absolute terms, when body weight is taken into account there is no difference. Aerobic capacity is directly related to VO2 max and so aerobically heavyweights and lightweights are equal. Rowing is not just an aerobic sport and where the heavyweight has the advantage is in anaerobic capacity. This means that on the rowing machine, when all other things are equal, the heavyweight will always beat the lightweight. This is not always the case on the water where under certain conditions the heavyweight's physical advantage is balanced by greater drag on the hull than that on a lightweight crew.
If asked why Denmark has been successful at lightweight level it would not be because of the training programme or because of the athletes. The key is to match the right training programme to the right athlete. This can be difficult for individuals rowing in a crew boat, but can be done during winter training on the rowing machine.
How is this Information Useful for Me?
The information presented above is collected and prepared by a professional sports physiologist. That does not mean that it is of no use to people who are not in national teams and do not have access to the testing facilities like those used by the Danes. All of the information used to create the graph, except the W6 point, can be easily found with no specialised equipment other than a Concept 2 Indoor Rower and a heart rate monitor as the following five points can be determined:
- Maximum power output over ten seconds.
- Anaerobic capacity over 60 seconds, stroke rate 36 to 46.
- Race pace over 2,000m, stroke rate 30 to 34.
- Aerobic capacity over 6,000m, stroke rate 26 to 28.
- Endurance over 60 minutes, stroke rate 22 to 24.
We have already found that it is possible to find the anaerobic threshold (W4) - see Physiological Tools in Section 3 : Physiology. This power output at AT should then be added to the graph at 44 minutes. If your point for W4 lies above the line and not on it as in the graphs above, this shows that your endurance is not as good as it could be and should be a point to focus on.
Once you have created your graph you should use it to create a table, replacing the split, power and heart rates at the different levels with the values from your graph. This will then allow you to train at the correct intensity for any time stipulated by your training programme. It is however important that, as you get fitter and stronger, you adjust your graph so that you are always training at the correct level to maximise improvements.

Table 4.7
| Training Intensities | ||||
|---|---|---|---|---|
| Training Intensity | Level | Split | Power (watts) | Heart Rate |
| Anaerobic Capacity/Power | A | |||
| Aerobic Capacity | B | |||
| Aerobic Capacity/Endurance | C | |||
| Endurance | D | |||
| Recovery/Technical Improvement | E | |||
Notes
Complete the table using the information from your graph.

